2022 Internet Usage Report
We surveyed people across the country to find out how their internet usage had changed during the pandemic.
Sep 26, 2022 | Share
Industry Exclusive/Entertainment
The COVID-19 pandemic changed how people around the world approach work, school, entertainment, social interactions, and much more. Each of these changes also shifted the ways people use the internet in their daily lives. We here at HighSpeedInternet.com are deeply interested in how internet access shapes people’s lives, and we believe the best way to understand such topics is to get firsthand information from internet users themselves.
We asked 1,000 people about their online habits and how they’ve changed since last year. While some activities, like dating, mostly happen online these days, there are still plenty of things people prefer to do in person. For example, while telehealth allowed many at-risk people to still see their doctors during the height of the pandemic, most people still prefer to go to their doctor in person.
Key findings and trends
- People spend about 8 hours online every day. The average amount of time respondents spent actively using the internet on a phone, tablet, or computer was 8 hours every day. This isn’t including more passive activities, such as streaming music or video in the background while doing other tasks.
- Internet usage is still increasing. Compared to last year, 44.7% of respondents said their internet usage had increased. Only 10% reported that their internet usage had decreased since last year, while 42.3% said their internet usage had remained about the same.
- People stream music in the background. The average American spends about 5 hours per day streaming music, podcasts, or other audio content. Those who regularly stream music or audio only give it their full attention 38% of the time as compared to streaming TV and movies, which people give their full attention 58% of the time.
- 75% of Americans research purchases online. Although people said that they preferred to shop for most things in person rather than online, 75% of our respondents said they always or frequently research products online before buying them. We like researching products too.
Most people prefer to go shopping in person
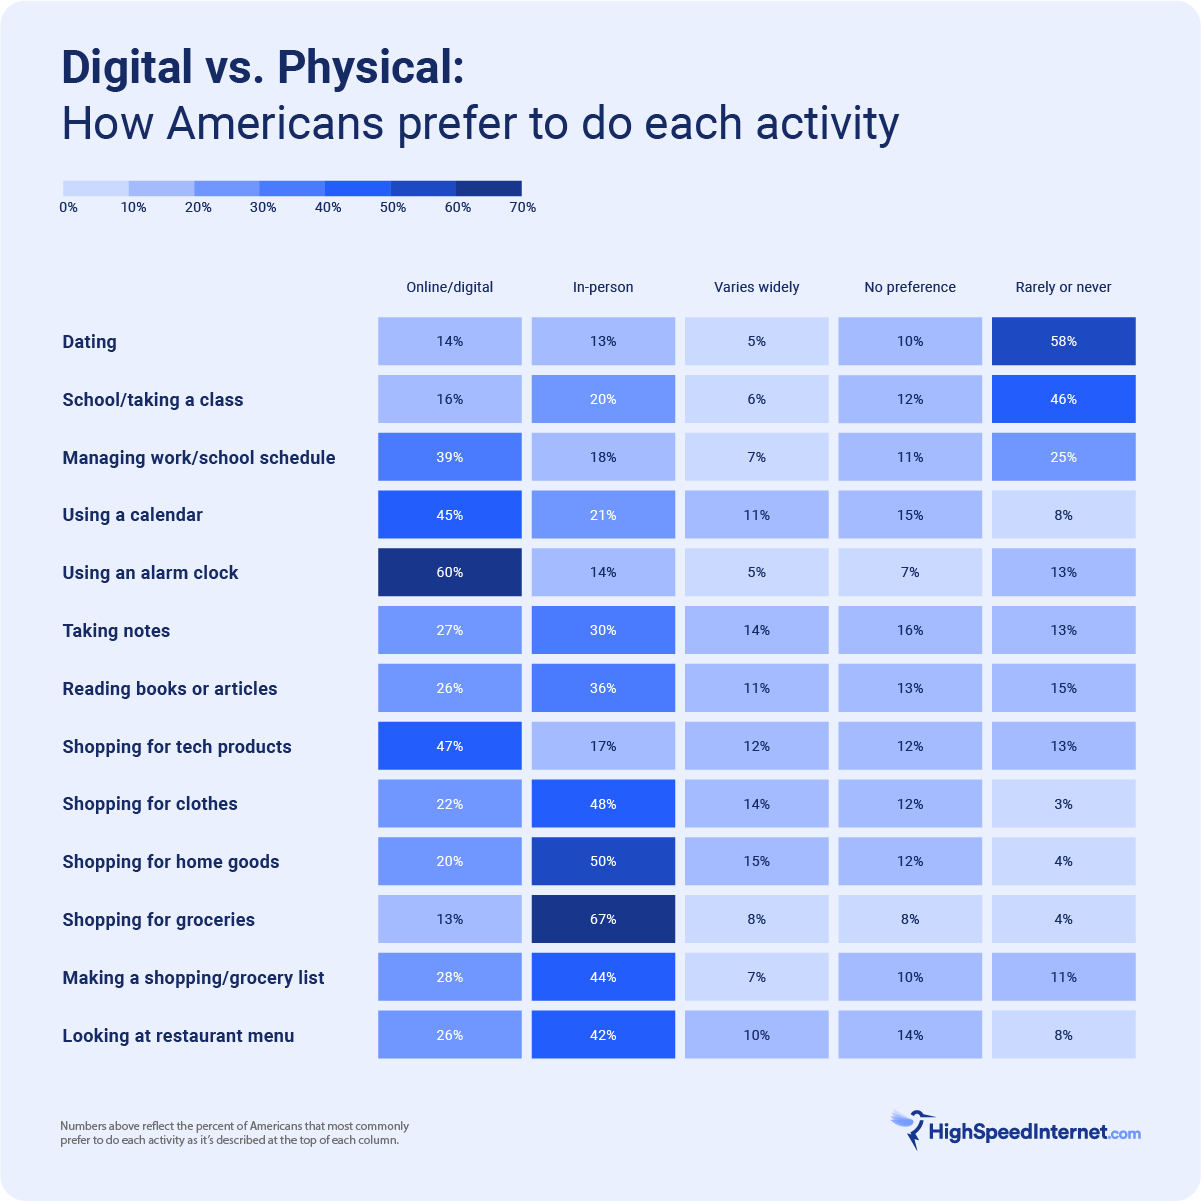
Most Americans still prefer doing many everyday tasks in person, despite the convenience that online services offer. This is especially true of shopping. Respondents preferred to shop for all the following items in person:
- Clothing (48% 22% who prefer online)
- Home goods (50% 20% who prefer online)
- Groceries (67% 13% who prefer online)
Although online grocery shopping services like Instacart exploded during the pandemic, a full two thirds of respondents said they prefer shopping for groceries in person. Tech is the only category where people reported preferring to buy online—47% of respondents would rather buy their tech products online (vs. only 17% who’d rather go to a store).
Romance and learning can happen anywhere
For other activities, the margins were much closer. Finding dates online just barely edged out meeting romantic prospects in-person (14% to 13%), while going to a physical school (20%) beat out online education (16%). Many people didn’t have a preference either way. When asked about school, 12% didn’t have a preference between online or in-person classes, while 10% said that they had no preference when it came to online vs. in-person dating.
People like physical books, menus, and grocery lists
When it comes to pen and paper objects versus digital and online tools, people’s opinions split in different directions. While most people seem to prefer online calendars, scheduling tools, and alarm clocks, they still prefer physical objects for a lot of things:
- Taking notes (30% 27% who prefer online)
- Reading books and articles (36% 26% who prefer online)
- Making a grocery list (44% 28% who prefer online)
- Looking at a restaurant menu (42% 26% who prefer online)
I’ve heard plenty of people wax poetic about the sights, sounds, and smells you experience flipping through a book, but maybe we should talk more about the joys of perusing the Denny’s menu.
We want to see our friends and doctors in person, but maybe not our boss
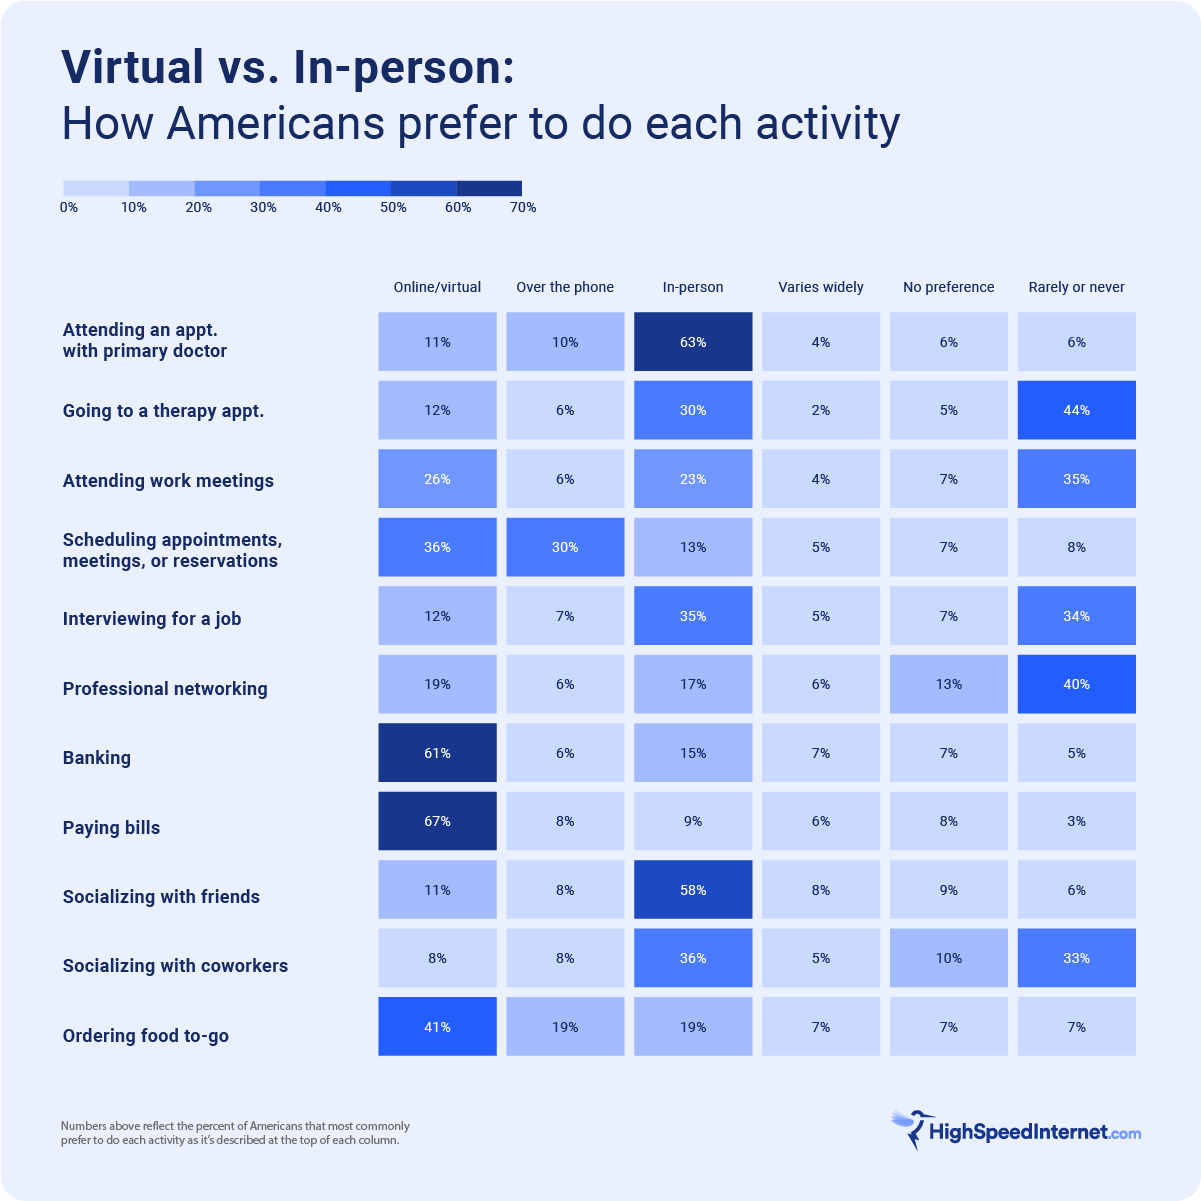
It should come as no surprise that, after two years of lockdowns and social distancing, people are eager to socialize with friends in person. A 58% majority of people prefer to socialize with their friends online, compared to only 11% who prefer to socialize virtually online.
People also want to meet in person when socializing with coworkers, talking with their therapist, or going to a job interview. People especially prefer to see their primary care doctor in person, with 63% of respondents saying that they prefer in-person appointments over telehealth.
Although telehealth seems to have a long way to go before it catches on, remote work is here to stay. People might like socializing with their coworkers in person, but when it comes to actual work meetings, more people prefer to attend virtually.
Banking and bill paying top the list of activities that people would rather do over the internet than in person. Apparently the free candy isn’t enough to entice people to walk into a brick-and-mortar bank.
We do more online, even if we’d prefer not to
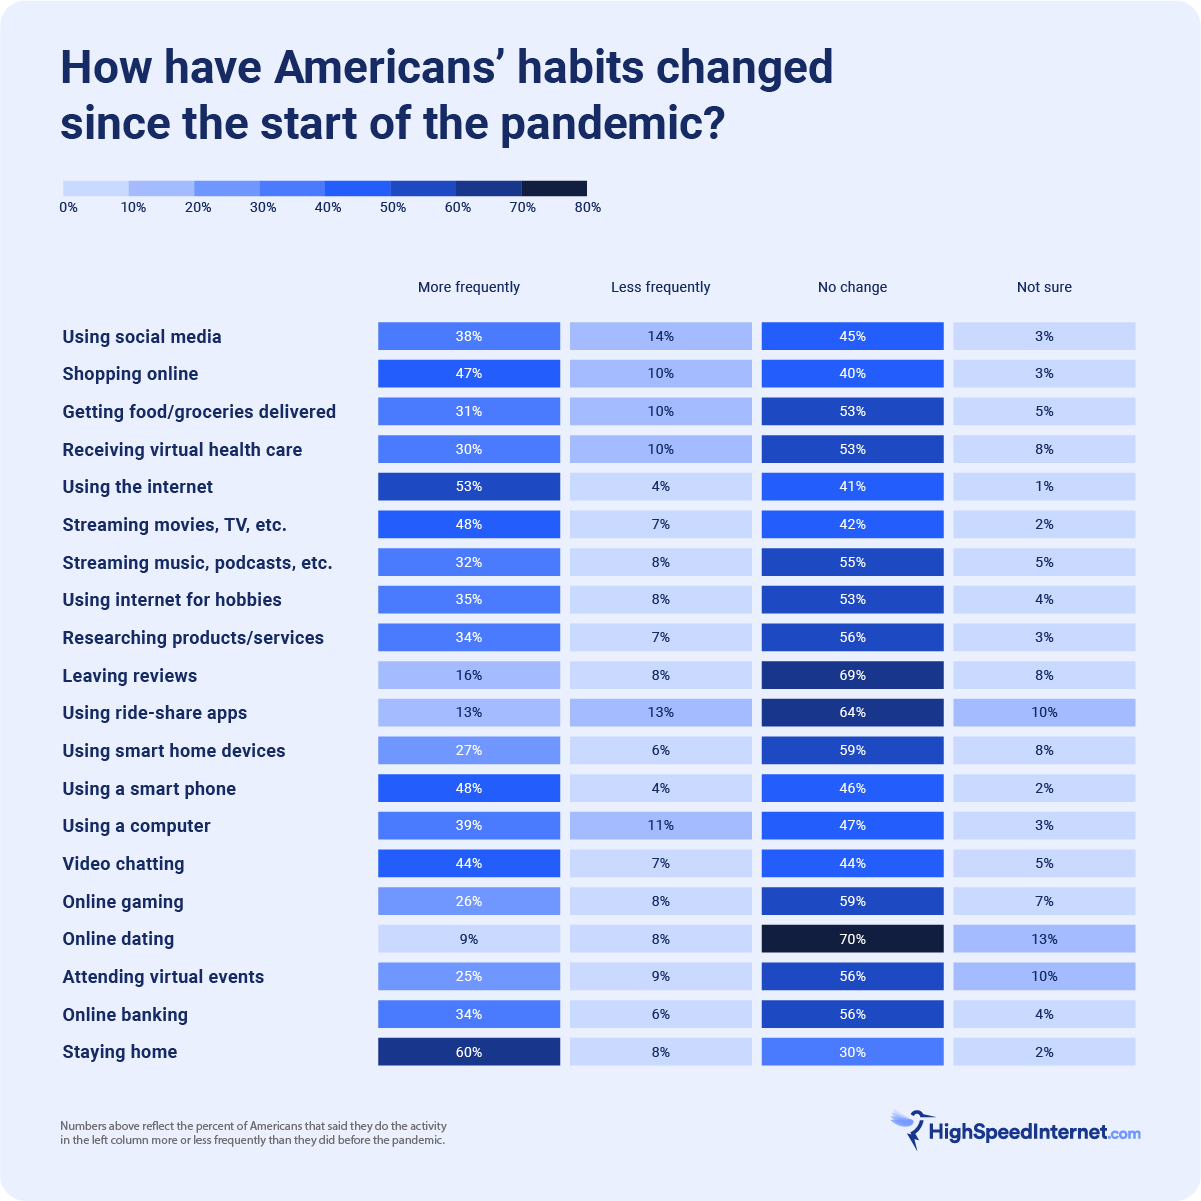
Even though people would prefer to do many things in person, we all do more online these days. People reported doing nearly all the online activities we asked about more frequently since the start of the pandemic, and few reported doing them less. Here are some notable activities people say they’re doing more frequently:
- Shopping online (47%)
- Buying groceries online (31%)
- Telehealth appointments (30%)
- Streaming movies, TV, and video (48%)
- Streaming music and audio (32%)
- Researching before a purchase (34%)
- Online banking (34%)
- Video chat or video conferencing (44%)
- Online gaming (26%)
Although people much prefer to go shopping or visit their doctor in person, a lot of people are doing these activities online more often. The only activity we asked about that people aren’t generally doing more of is using rideshare apps—64% of respondents reported no change, whereas 13% said they use it more and 13% said they use it less.
Perhaps the stat that best sums up the changes that have occurred since the start of the pandemic is that 60% of people say they still stay home more than they did before the pandemic. As long as that trend continues, we’re going to be relying more on the internet, whether we like it or not.
Do you need more speed to keep up with your online activities, or are you paying for more bandwidth than you actually use? Use our tool to find out how much internet speed you actually need.
Methodology
HighSpeedInternet.com ran a survey of 1,000 Americans aged 18+ in September 2022, using the online survey platform PollFish. The results shown above are post-stratified. Post-stratification weighting method is a way to achieve a distribution equal with that of such known characteristics of the population. In this case, it was applied to age and gender. If you have questions about the survey, methodology or data in this report, you can email them to [email protected].
Author - Peter Christiansen
Peter Christiansen writes about satellite internet, rural connectivity, livestreaming, and parental controls for HighSpeedInternet.com. Peter holds a PhD in communication from the University of Utah and has been working in tech for over 15 years as a computer programmer, game developer, filmmaker, and writer. His writing has been praised by outlets like Wired, Digital Humanities Now, and the New Statesman.
